lauantai 27. elokuuta 2011
HAMINA-FINLAND
Hamina
| Hamina | |||
|---|---|---|---|
| — Town — | |||
| Haminan kaupunki | |||
 | |||
| |||
 | |||
| Coordinates: 60°34′N 027°12′ECoordinates: 60°34′N 027°12′E | |||
| Country | Finland | ||
| Region | Kymenlaakso | ||
| Sub-region | Kotka–Hamina sub-region | ||
| Charter | 1653 | ||
| Government | |||
| - Town manager | Hannu Muhonen | ||
| Area(2011-01-01)[1] | |||
| - Total | 1,155.17 km2 (446 sq mi) | ||
| - Land | 609.51 km2 (235.3 sq mi) | ||
| - Water | 545.66 km2 (210.7 sq mi) | ||
| Area rank | 98th largest in Finland | ||
| Population (2011-01-31)[2] | |||
| - Total | 21,402 | ||
| - Rank | 50th largest in Finland | ||
| - Density | 35.11/km2 (90.9/sq mi) | ||
| Population by native language[3] | |||
| - Finnish | 96.1% (official) | ||
| - Swedish | 0.4% | ||
| - Others | 3.5% | ||
| Population by age[4] | |||
| - 0 to 14 | 15.1% | ||
| - 15 to 64 | 63.8% | ||
| - 65 or older | 21.1% | ||
| Time zone | EET (UTC+2) | ||
| - Summer (DST) | EEST (UTC+3) | ||
| Municipal tax rate[5] | 20% | ||
| Website | www.hamina.fi | ||


Hamina (Finnish pronunciation: [ˈhɑminɑ]; Swedish: Fredrikshamn, [freːdriksˈhamn]) is a town and a municipality of Finland. It is located in the province of Southern Finland and is part of the Kymenlaakso region. The town has a population of 21,402 (31 January 2011)[2] and covers an area of 1,155.17 square kilometres (446.01 sq mi) of which 545.66 km2 (210.68 sq mi) is water.[1] The population density is 35.11 inhabitants per square kilometre (90.9 /sq mi). The population of the main town is approximately 5,000. Hamina is unilingually Finnish speaking. Hamina is also one of the most important harbours of Finland. The port specialises in forest products and transit cargo to Russia.
Contents |
History
Vehkalahti county was mentioned in the documents for the first time in 1336. At the proposal of Count Peter Brahe, the area surrounding the church of Vehkalahti was separated from rest of Vehkalahti in 1653 and it became a town called Vehkalahden Uusikaupunki (Veckelax Nystad in Swedish, "Newtown of Vehkalahti"). The town was destroyed during the Great Northern War in 1712.[6]
As the important foreign trade town of Viipuri was surrendered to Russians in 1721, this town (newly renamed in honour of the King Frederick I of Sweden in 1723) was intended to replace it. The town, hitherto a small domestic trade port with restricted trade, was granted extensive privileges including foreign trade. Finnish people soon shortened the name to Hamina. The rebuilding of the town took place in 1722–1724. The star-shaped fortress and the circular town plan are based on an Italian renaissance fortress concept from the 16th century.[6] Fortress towns like this are quite rare, another example is Palmanova in Italy.[7]
In 1743 Hamina was surrendered to Russians, after the Russo–Swedish War, 1741–1743, and the town of Loviisa was the next Swedish candidate for an Eastern-Finnish trade centre. Hamina became a Russian frontier town, for which a fortress was desirable.
The Treaty of Fredrikshamn (1809), by which Sweden ceded Finland, including parts of the province of Lappland and the Åland Islands, was signed in Hamina. Thus Sweden was split and the eastern half, along with previously conquered territories including Hamina (Old Finland), was formed into the Grand Duchy of Finland, an autonomous part of the Russian Empire.
Hamina Cadet School was founded in 1819 and it was in function until 1903. In 1920 the Reserve Officer School began in the same facilities.
Because the town was once founded next to the Vehkalahti Church, the municipal center had always been inside the town borders. Vehkalahti and Hamina were consolidated in 2003, and the old coat of arms was replaced with Vehkalahti's coat of arms.
Main sights
- St. Mary's church. Originally medieval, it was damaged by fire in 1821 and renovated by Carl Ludvig Engel in 1828. It is the oldest building in Kymenlaakso.[8][9]
- St. John's Church, designed by Carl Ludvig Engel in 1843.
- Orthodox Church of St Peter and St Paul (1837). The church is built on a site where two other churches (Ulrika Eleonora Church, built in 1732 and destroyed in 1742, and Elizabeth Church, built in 1750 and destroyed in 1821) were located. The belfry is built in 1862.[9]
- Town Hall. Originally built in 1798, it was renovated by Carl Ludvig Engel in 1840.
- Reserve Officer School
- Town Museum. It is located in a building where King Gustav III of Sweden and Empress Catherine II of Russia met in 1783.[8]
- Shopkeeper's Museum
- Google Data Center (former Stora Enso pulp factory)
- Hamina Fortress, built in the 18th century. The corners of the fortress form six bastions, named after towns in Finland. The Central Bastion was added at the end of the 18th century, and is currently used for cultural events.
Gallery
-

The old coat of arms, in use till 2003
-

St Mary's church (former Vehkalahti church)
-

The orthodox church of Peter and Paul
-

Reserve officer's school
-
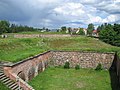
The old fortress
-

Central bastion of the fortress
-

Tanelinkulma
-

The yacht club's pavilion
-

The flag tower, the only remaining part of the Helsinki bastion
-

Pikkuympyräkatu; "The Little Circle Street"
-

The old locomotive warehouse
-

Aholaisenkulma ("The Aholainen's corner"), a historical restaurant and hotel, demolished in the autum of 2008
-

The town museum
-

The shopkeeper's museum
-

The Vehkalahti municipal museum


Notes
- ^ a b "Area by municipality as of 1 January 2011" (in Finnish and Swedish) (PDF). Land Survey of Finland. Retrieved 9 March 2011.
- ^ a b "Population by municipality as of 31 January 2011" (in Finnish and Swedish). Population Information System. Population Register Center of Finland. Retrieved 18 February 2011.
- ^ "Population according to language and the number of foreigners and land area km2 by area as of 31 December 2008". Statistics Finland's PX-Web databases. Statistics Finland. Retrieved 29 March 2009.
- ^ "Population according to age and gender by area as of 31 December 2008". Statistics Finland's PX-Web databases. Statistics Finland. Retrieved 28 April 2009.
- ^ "List of municipal and parish tax rates in 2011". Tax Administration of Finland. 29 November 2010. Retrieved 13 March 2011.
- ^ a b Hamina
- ^ Kopomaa, Timo (2005). "Kriisioloihin varautunut kaupunki" (in Finnish) (PDF). Yhdyskuntasuunnittelu (Helsinki: Yhdyskuntasuunnittelun seura ry (The Finnish Society of Housing and Planning)) 43 (2): 6–26. Retrieved 25 January 2009.
- ^ a b Hamina
- ^ a b Churches in Finland
External links
| Wikimedia Commons has media related to: Hamina |
|
Municipalities of Kymenlaakso | ||
|---|---|---|
|
| ||
| Municipalities |  | |
|
| ||
| Former municipalities | Anjala · Anjalankoski · Elimäki · Haapasaari · Jaala · Karhula · Kuusankoski · Kymi · Sippola · Suursaari · Tytärsaari · Valkeala · Vehkalahti | |
|
| ||
| Kymenlaakso · Finland | ||
maanantai 22. elokuuta 2011
lauantai 6. elokuuta 2011
ALL COUNTRIES and POPULATIONS - MAAILMAN VALTIOT ja VÄKILUVUT -
List
Rank | Country / Territory | Population | Date of estimate | % of World population | Source |
|---|---|---|---|---|---|
| - | World | 6,935,500,000 | August 5, 2011 | 100% | US Census Bureau's World Population Clock |
| 1 | 1,339,724,852 | November 1, 2010 | 19.32% | 2010 China Census | |
| 2 | 1,210,193,422 | March 1, 2011 | 17.45% | Provisional 2011 Indian Census result | |
| 3 | 311,901,000 | August 5, 2011 | 4.5% | Official United States Population Clock | |
| 4 | 237,556,363 | May 2010 | 3.43% | 2010 Indonesian Census | |
| 5 | 190,732,694 | August 1, 2010 | 2.75% | 2010 Official Brazilian Census results | |
| 6 | 176,835,000 | August 5, 2011 | 2.55% | Official Pakistani Population clock | |
| 7 | 158,423,000 | 2010 | 2.28% | UN estimate for 2010 | |
| 8 | 151,030,000 | August 5, 2011 | 2.18% | Official Bangladeshi Population Clock | |
| 9 | 142,905,200 | January 1, 2011 | 2.06% | 2010 Russian Census | |
| 10 | 127,950,000 | June 1, 2011 | 1.84% | Official Japan Statistics Bureau | |
| 11 | 112,336,538 | April 15, 2011 | 1.62% | 2010 final census result | |
| 12 | 94,013,200 | Mid-2010 | 1.36% | National Statistics Office medium projection | |
| 13 | 87,375,000 | 2011 | 1.26% | Official estimate | |
| 14 | 82,101,998 | 2011 | 1.18% | Official estimate | |
| 15 | 81,751,602 | January 1, 2011 | 1.18% | Official estimate | |
| 16 | 80,619,000 | August 5, 2011 | 1.16% | Official Egyptian Population clock | |
| 17 | 75,532,000 | August 5, 2011 | 1.09% | Official Iranian Population clock | |
| 18 | 73,722,988 | December 31, 2010 | 1.06% | Turkish Statistical Institute | |
| 19 | 67,041,000 | July 1, 2010 | 0.97% | Key Statistics of Thailand, 2009, Table 1.4 (Population projections), National Statistics Office of Thailand | |
| 20 | 65,966,000 | 2010 | 0.95% | UN estimate for 2010 | |
| 21 | 65,821,885 | January 1, 2011 | 0.95% | Official INSEE estimate The population figure for metropolitan France alone (without its overseas departments and oveseas collectivities) is 63,182,000.[4] | |
| 22 | 62,435,709 | January 1, 2011 | 0.9% | Eurostat estimate | |
| 23 | 60,626,442 | December 31, 2010 | 0.87% | Official ISTAT estimate | |
| 24 | 50,586,757 | July 1, 2011 | 0.73% | Statistics South Africa: Mid-year population estimates, 2011 | |
| 25 | 48,988,833 | 2011 | 0.71% | Statistics Korea | |
| 26 | 47,963,000 | 2010 | 0.73% | UN estimate for 2010 | |
| 27 | 46,148,605 | April 1, 2011 | 0.67% | Official INE estimate | |
| 28 | 46,097,000 | August 5, 2011 | 0.66% | Official Colombian Population clock | |
| 29 | 45,706,126 | May 1, 2011 | 0.66% | Official UKRSTAT estimate | |
| 30 | 43,187,823 | 2010 | 0.62% | Official estimate | |
| 31 | 40,091,359 | October 27, 2010 | 0.58% | Provisional census results | |
| 32 | 38,610,097 | August 24–25, 2009 | 0.56% | Official census results | |
| 33 | 38,186,860 | 2010 | 0.55% | Official estimate | |
| 34 | 36,300,000 | January 1, 2011 | 0.52% | Official estimate | |
| 35 | 34,539,000 | August 5, 2011 | 0.5% | Official Canadian Population clock | |
| 36 | 32,221,000 | August 5, 2011 | 0.46% | Official Moroccan Population clock | |
| 37 | 31,800,000 | 2010 | 0.46% | Official estimate | |
| 38 | 31,672,000 | 2010 | 0.45% | UN estimate for 2010 | |
| 39 | 31,412,000 | 2010 | 0.42% | UN estimate for 2010 | |
| 40 | 30,894,000 | 2008 | 0.45% | 2008 census results | |
| 41 | 29,461,933 | June 30, 2010 | 0.42% | Official INEI estimate (in Spanish) | |
| 42 | 29,316,000 | August 5, 2011 | 0.42% | Official Venezuelan Population clock | |
| 43 | 28,584,975 | 2011 | 0.41% | Official estimate | |
| 44 | 27,565,821 | 2010 | 0.4% | The 2010 Population and Housing Census (Census 2010) | |
| 45 | 27,445,000 | 2010 | 0.4% | UN estimate for 2010 | |
| 46 | 27,136,977 | 2010 | 0.39% | Official Saudi estimate | |
| 47 | 24,346,000 | 2010 | 0.35% | UN estimate for 2010 | |
| 48 | 24,233,431 | September 26, 2010 | 0.35% | Provisional 2010 census results | |
| 49 | 23,695,000 | 2010 | 0.34% | Civil affairs records(2010) | |
| 50 | 23,174,528 | May 31, 2011 | 0.33% | Official National Statistics Taiwan estimate | |
| 51 | 22,670,282 | August 5, 2011 | 0.33% | Australian Official Population Clock | |
| 52 | 22,492,035 | 2009 | 0.32% | Official estimate | |
| 53 | 22,416,881 | 2010 | 0.32% | Official estimate | |
| 54 | 21,413,815 | January 1, 2011 | 0.31% | Eurostat estimate | |
| 55 | 20,714,000 | 2010 | 0.29% | UN estimate for 2010 | |
| 56 | 20,669,000 | 2010 | 0.29% | UN estimate for 2010 | |
| 57 | 19,738,000 | 2010 | 0.31% | UN estimate for 2010 | |
| 58 | 19,406,100 | January 1, 2010 | 0.28% | Official estimate | |
| 59 | 19,082,000 | 2010 | 0.27% | UN estimate for 2010 | |
| 60 | 17,263,500 | August 5, 2011 | 0.25% | Official INE projection (page 36) | |
| 61 | 16,687,000 | August 5, 2011 | 0.241% | Official Netherlands population clock | |
| 62 | 16,518,000 | May 1, 2011 | 0.24% | National Statistics Agency estimate | |
| 63 | 15,730,977 | July 1, 2010 | 0.23% | Official estimate | |
| 64 | 15,730,754 | 2011 | 0.23% | Official estimate | |
| 65 | 14,901,000 | 2010 | 0.23% | UN estimate for 2010 | |
| 66 | 14,517,176 | April 1, 2009 | 0.21% | Preliminary 2009 census result | |
| 67 | 14,361,666 | 2010 | 0.21% | Official estimate | |
| 68 | 14,306,876 | November 28, 2010 | 0.21% | Preliminary 2010 Ecuadorian census result | |
| 69 | 13,395,682 | March 3, 2008 | 0.19% | Cambodian 2008 Census | |
| 70 | 13,046,508 | October 16, 2010 | 0.19% | 2010 Zambia Census result | |
| 71 | 12,571,000 | 2010 | 0.18% | UN estimate for 2010 | |
| 72 | 12,434,000 | 2010 | 0.19% | UN estimate for 2010 | |
| 73 | 11,241,161 | December 31, 2010 | 0.16% | Official estimate | |
| 74 | 11,227,000 | 2010 | 0.17% | UN estimate for 2010 | |
| 75 | 10,918,405 | January 1, 2011 | 0.16% | Eurostat estimate | |
| 76 | 10,787,690 | June 1, 2011 | 0.16% | 2011 census estimate | |
| 77 | 10,636,979 | January 1, 2011 | 0.15% | Eurostat estimate | |
| 78 | 10,549,100 | July 1, 2010 | 0.15% | National Statistics Institute of Tunisia | |
| 79 | 10,535,811 | March 31, 2011 | 0.15% | Official estimate | |
| 80 | 10,426,154 | 2010 | 0.15% | Official estimate | |
| 81 | 10,412,820 | 2010 | 0.15% | Official estimate | |
| 82 | 10,085,214 | 2010 | 0.15% | Official estimate | |
| 83 | 9,986,000 | January 1, 2011 | 0.14% | Official estimate | |
| 84 | 9,982,000 | 2010 | 0.15% | UN estimate for 2010 | |
| 85 | 9,469,000 | June 1, 2011 | 0.14% | National Statistical Committee | |
| 86 | 9,440,588 | May 31, 2011 | 0.14% | Statistics Sweden | |
| 87 | 9,378,818 | December 1, 2010 | 0.14% | Preliminary census result | |
| 88 | 9,331,000 | 2010 | 0.13% | UN estimate for 2010 | |
| 89 | 9,165,000 | July 1, 2011 | 0.13% | State Statistical Committee of Azerbaijan | |
| 90 | 8,778,646 | 2010 | 0.13% | Official estimate | |
| 91 | 8,404,252 | January 1, 2011 | 0.12% | [3] | |
| 92 | 8,383,000 | 2010 | 0.12% | UN estimate for 2010 | |
| 93 | 8,264,070 | Mid-2010 | 0.119% | Official estimate | |
| 94 | 8,260,490 | 2008 | 0.12% | 2008 census results | |
| 95 | 8,215,313 | 2011 | 0.12% | Official estimate | |
| 96 | 7,866,500 | December 31, 2010 | 0.11% | Official Switzerland Statistics estimate | |
| 97 | 7,751,000 | May, 2011 | 0.11% | Israeli Central Bureau of Statistics | |
| 98 | 7,364,570 | February, 2011 | 0.11% | Census figures | |
| 99 | 7,306,677 | January 1, 2010 | 0.11% | Official estimate | |
| 100 | 7,097,600 | December 31, 2010 | 0.102% | Hong Kong Census and Statistics Department | |
| 101 | 6,879,000 | 2010 | 0.102% | UN estimate for 2010 | |
| 102 | 6,703,000 | 2010 | 0.099% | UN estimate for 2010 | |
| 103 | 6,355,000 | 2010 | 0.094% | UN estimate for 2010 | |
| 104 | 6,230,200 | 2010 | 0.09% | Official estimate | |
| 105 | 6,230,000 | 2010 | 0.093% | UN estimate for 2010 | |
| 106 | 6,193,000 | 2010 | 0.089% | UN estimate for 2010 | |
| 107 | 6,187,000 | 2010 | 0.093% | UN estimate for 2010 | |
| 108 | 6,028,000 | 2010 | 0.098% | UN estimate for 2010 | |
| 109 | 5,868,000 | 2010 | 0.084% | UN estimate for 2010 | |
| 110 | 5,788,000 | 2010 | 0.084% | UN estimate for 2010 | |
| 111 | 5,564,219 | April 1, 2011 | 0.08% | Statistics Denmark | |
| 112 | 5,435,273 | December 31, 2010 | 0.078% | Statistics Slovakia | |
| 113 | 5,418,300 | 2010 | 0.078% | Official estimate | |
| 114 | 5,388,400 | August 5, 2011 | 0.078% | Official Finnish Population clock | |
| 115 | 5,254,000 | 2010 | 0.075% | UN estimate for 2010 | |
| 116 | 5,076,700 | June 30, 2010 | 0.073% | Statistics Singapore | |
| 117 | 5,042,000 | 2010 | 0.075% | UN estimate for 2010 | |
| 118 | 4,960,900 | August 5, 2011 | 0.072% | Official Norwegian Population clock | |
| 119 | 4,581,269 | April 10, 2011 | 0.066% | Central Statistics Office Ireland | |
| 120 | 4,563,538 | 2010 | 0.066% | Official estimate | |
| 121 | 4,401,000 | 2010 | 0.065% | UN estimate for 2010 | |
| 122 | 4,436,400 | January 1, 2010 | 0.064% | National Statistics Office of Georgia | |
| 123 | 4,412,800 | August 5, 2011 | 0.064% | Official New Zealand Population clock | |
| 124 | 4,290,612 | 2011 | 0.062% | ,[5]Eurostat estimate | |
| 125 | 4,228,000 | 2010 | 0.061% | UN estimate for 2010 | |
| 126 | 4,043,000 | 2010 | 0.054% | 2008 UN estimate for year 2010 | |
| 127 | 3,994,000 | 2010 | 0.059% | UN estimate for 2010 | |
| 128 | 3,935,249 | 2009 | 0.057% | Palestinian Central Bureau of Statistics | |
| 129 | 3,843,126 | June 30, 2010 | 0.055% | Official estimate | |
| 130 | 3,725,789 | April 1, 2010 | 0.054% | 2010 census | |
| 131 | 3,563,800 | January 1, 2010 | 0.051% | National Bureau of Statistics of Moldova | |
| 132 | 3,460,000 | 2010 | 0.049% | UN estimate for 2010 | |
| 133 | 3,405,813 | May 16, 2010 | 0.049% | Final 2010 census results | |
| 134 | 3,356,584 | June 30, 2010 | 0.048% | Official estimate | |
| 135 | 3,263,600 | March 2011 | 0.047% | Monthly official estimate | |
| 136 | 3,221,200 | June 2011 | 0.046% | Monthly official estimate | |
| 137 | 3,195,000 | January 1, 2010 | 0.046% | Institute of Statistics INSTAT Albania | |
| 138 | 2,814,900 | August 5, 2011 | 0.04% | Official Mongolian population clock | |
| 139 | 2,737,000 | 2010 | 0.044% | UN estimate for 2010 | |
| 140 | 2,705,827 | December 31, 2010 | 0.039% | [4] | |
| 141 | 2,694,094 | December 12, 2010 | 0.039% | Preliminary census results | |
| 142 | 2,283,000 | 2010 | 0.032% | UN estimate for 2010 | |
| 143 | 2,218,800 | June 2011 | 0.032% | Official Statistics of Latvia | |
| 144 | 2,171,000 | 2010 | 0.03% | UN estimate for 2010 | |
| 145 | 2,057,284 | January 1, 2011 | 0.03% | Eurostat estimate | |
| 146 | 2,052,650 | August 5, 2011 | 0.03% | Official Slovenian population clock | |
| 147 | 1,800,098 | 2010 | 0.026% | Official estimate | |
| 148 | 1,728,000 | 2010 | 0.025% | UN estimate for 2010 | |
| 149 | 1,696,563 | April 20, 2010 | 0.024% | Preliminary 2010 Census Results | |
| 150 | 1,515,000 | 2010 | 0.024% | UN estimate for 2010 | |
| 151 | 1,505,000 | 2010 | 0.022% | UN estimate for 2010 | |
| 152 | 1,340,122 | January 1, 2011 | 0.019% | Official estimate | |
| 153 | 1,317,714 | July 1, 2010 | 0.019% | Official estimate | |
| 154 | 1,280,925 | July 1, 2010 | 0.018% | Official estimate | |
| 155 | 1,262,000 | 2010 | 0.012% | UN estimate for 2010 | |
| 156 | 1,186,000 | 2010 | 0.017% | UN estimate for 2010 | |
| 157 | 1,124,000 | 2010 | 0.017% | UN estimate for 2010 | |
| 158 | 889,000 | 2010 | 0.013% | UN estimate for 2010 | |
| 159 | 861,000 | 2010 | 0.012% | UN estimate for 2010 | |
| 160 | 804,435 | January 1, 2011 | 0.012% | Eurostat Statistics | |
| 161 | 784,894 | 2010 | 0.011% | Official estimate | |
| 162 | 735,000 | 2010 | 0.01% | UN estimate for 2010 | |
| 163 | 700,000 | 2010 | 0.01% | UN estimate for 2010 | |
| 164 | 695,822 | 2010 | 0.01% | Official estimate | |
| 165 | 625,266 | 2011 | 0.009% | 2011 Preliminary Census Data | |
| 166 | 556,800 | March 31, 2011 | 0.008% | Macau Statistics and Census Service | |
| 167 | 531,000 | 2010 | 0.008% | UN estimate for 2010 | |
| 168 | 530,669 | 2010 | 0.008% | Official estimate | |
| 169 | 525,000 | 2010 | 0.008% | UN estimate for 2010 | |
| 170 | 502,100 | 2010 | 0.007% | Official estimate | |
| 171 | 491,575 | June 16, 2010 | 0.007% | Official estimate | |
| 172 | 417,608 | January 1, 2011 | 0.006% | Eurostat estimate | |
| 173 | 399,000 | 2010 | 0.006% | UN estimate for 2010 | |
| 174 | 353,658 | May 3, 2010 | 0.005% | Official estimate | |
| 175 | 333,200 | Mid-2009 | 0.005% | Statistical Institute of Belize | |
| 176 | 318,452 | January 1, 2011 | 0.005% | Statistics Iceland | |
| 177 | 317,280 | 2010 | 0.005% | Official estimate | |
| 178 | 273,000 | 2010 | 0.004% | UN estimate for 2010 | |
| 179 | 240,000 | 2010 | 0.004% | UN estimate for 2010 | |
| 180 | 187,032 | 2010 | 0.003% | Official estimate | |
| 181 | 180,000 | 2010 | 0.003% | UN estimate for 2010 | |
| 182 | 166,526 | May 10, 2010 | 0.002% | Preliminary census result | |
| 183 | 165,000 | 2010 | 0.002% | UN estimate for 2010 | |
| 184 | 142,180 | January 1, 2010 | 0.002% | Official estimate | |
| 185 | 109,000 | 2010 | 0.002% | UN estimate for 2010 | |
| 186 | 109,000 | 2010 | 0.002% | UN estimate for 2010 | |
| 187 | 107,000 | 2010 | 0.002% | UN estimate for 2010 | |
| 188 | 104,000 | 2010 | 0.001% | UN estimate for 2010 | |
| 189 | 104,000 | 2010 | 0.001% | UN estimate for 2010 | |
| 190 | 102,624 | April 4, 2010 | 0.001% | Preliminary census results | |
| 191 | 100,000 | 2010 | 0.001% | UN estimate for 2010 | |
| 192 | 92,500 | December 31, 2009 | 0.001% | Official estimate | |
| 193 | 89,000 | 2010 | 0.001% | UN estimate for 2010 | |
| 194 | 86,525 | July 1, 2010 | 0.001% | Official estimate | |
| 195 | 84,082 | December 31, 2009 | 0.001% | Official estimate | |
| 196 | 83,000 | 2010 | 0.001% | UN estimate for 2010 | |
| 197 | 68,000 | 2010 | 0.001% | UN estimate for 2010 | |
| 198 | 68,000 | 2010 | 0.001% | UN estimate for 2010 | |
| 199 | 64,566 | July 1, 2010 | 0.001% | Official estimate | |
| 200 | 62,431 | March 31, 2010 | 0.001% | Official estimate | |
| 201 | 61,000 | 2010 | 0.001% | UN estimate for 2010 | |
| 202 | 56,452 | 2010 | 0.001% | Official estimate | |
| 203 | 54,878 | October 10, 2010 | 0.001% | Preliminary census result | |
| 204 | 54,305 | 2010 | 0.001% | Official estimate | |
| 205 | 52,000 | 2010 | 0.001% | UN estimate for 2010 | |
| 206 | 48,596 | April 1, 2011 | 0.001% | Official statistics of the Faroe Islands | |
| 207 | 40,357 | 2010 | 0.0006% | Official estimate | |
| 208 | 37,429 | January 1, 2010 | 0.0005% | Official estimate | |
| 209 | 36,157 | December 31, 2010 | 0.0005% | Official estimate | |
| 210 | 35,000 | 2010 | 0.0005% | UN estimate for 2010 | |
| 211 | 31,887 | December 31, 2010 | 0.0005% | Monthly official estimate | |
| 212 | 29,441 | 2010 | 0.0004% | [5] | |
| 213 | 28,213 | 2008 | 0.0004% | Official estimate | |
| 214 | 24,600 | December 2010 | 0.0004% | Official monthly estimate | |
| 215 | 20,000 | 0.0003% | UN estimate for 2010 | ||
| 216 | 15,236 | 2011 | 0.0002% | Official estimate | |
| 217 | 10,000 | 0.0001% | UN estimate for 2010 | ||
| 218 | 10,000 | 0.0001% | UN estimate for 2010 | ||
| 219 | 6,000 | 0.0001% | UN estimate for 2010 | ||
| 220 | 4,000 | 0.0001% | 2008 UN estimate for year 2010 | ||
| 221 | 3,000 | 0.00005% | UN estimate for 2010 | ||
| 222 | 1,500 | 0.00003% | UN estimate for 2010 | ||
| 223 | 1,100 | 0.00003% | UN estimate for 2010 | ||
| 224 | 500 | 0.00001% | UN estimate for 2010 | ||
| 225 | 50 | 0.000001% | UN estimate |